Introducing seqfind.com
I'm officially launching seqfind.com – the Clojure(script) code explorer.
Technically, this is a relaunch. I did a soft launch with just a handful of repos a few years ago, but for various reasons I was unable to push it to the next stage until now. It now contains the majority of the Clojure OSS ecosystem on GitHub, courtesy of the fantastic Dewey data set maintained by phronmophobic (Adrian Smith) which uses clj-kondo analysis to extract data from GitHub.
This post explains what seqfind is, how to use it, what's new and what's planned since that initial early release back in 2022.
A Brief Intro
Would you like to optimize your learning of Clojure? Would you like to focus on learning only the most useful parts of the language first? Take this lesson from second language learning: learn the expressions in order of frequency of use.
- Eric Normand in The 100 Most Used Clojure Expressions
This article was the inspiration for seqfind and also a big part of my Clojure journey. I realized that the approach of becoming familiar with the most frequently used parts of the Clojure language could also be extended to the many libraries in its ecosystem to optimize learning. Further, because its a lisp, traversing code as a set of lists makes it well-suited for analysis.
The idea was clear: make it easy to look at any library to find its most useful parts and how people are using them in real applications. In most libraries, a small number of functions account for the vast majority of usage, while the rest are infrequently used. seqfind is there to help you identify and study them.
This project is a living counterpart to project documentation. It's a database of real-world usage examples of functions from across the open source Clojure ecosystem on GitHub.
My hope is that this helps both library users as well as their authors. Perhaps it can complement written docs and allow maintainers to identify usage patterns they weren't aware of and never intended.
An Example: clojure.core/map
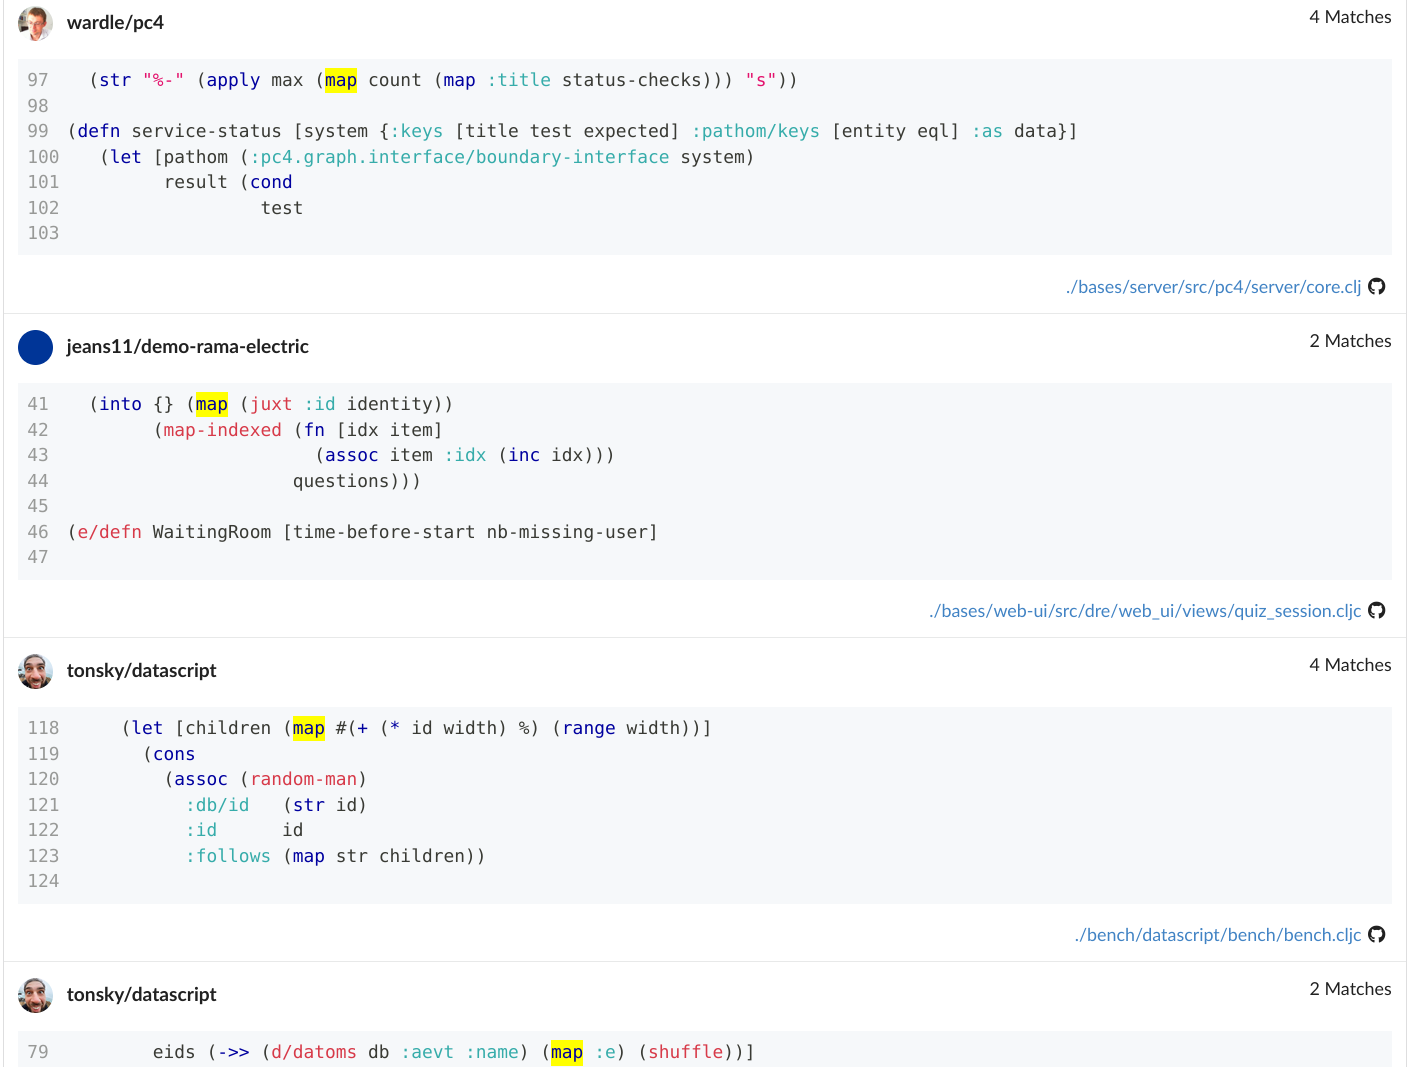
Suppose you're new to Clojure and want to see more examples of using map. You navigate to the corresponding seqfind page at seqfind.com/clojure/clojure/clojure.core/map/usages and see something like this:
The results are fairly illuminating. From the fn's docstring you learn that map returns a lazy sequence and some other details, but the writing is fairly terse:
Returns a lazy sequence consisting of the result of applying f to the set of first items of each coll, followed by applying f to the set of second items in each coll, until any one of the colls is exhausted. Any remaining items in other colls are ignored. Function f should accept number-of-colls arguments. Returns a transducer when no collection is provided.
The seqfind results show a different angle. map can be used in at least a few different ways (in order):
- with a simple fn name like
count - as an
intotransducer'sxformwith function composition throughjuxt - with an shorthand anonymous fn
#(...) - as part of a
->>sequence transformation macro with a keyword argument:e
If you're new to Clojure, these examples can teach you many things that aren't plainly evident from the docs.
While I chose to showcase the well-known map fn here, what I want to emphasize is that you can get similar examples for most functions in the entire ecosystem - whether they are from any of the official Clojure libraries or some relatively unknown library with just a few users.
What I found very satisfying was that I used seqfind myself in the creation of seqfind! While trying to figure out different parts of Fulcro (which seqfind is built on), I regularly consulted the relevant function profiles in seqfind to help me better understand what I read in Fulcro's docs.
Some Details
Quite a bit has changed since that initial early release in 2022:
- URL structure now takes inspiration from cljdoc.org:
/clojure/clojure/functions: the repo's profile showing popular functions/clojure/clojure/clojure.corethe namespace's profile showing its functions/clojure/clojure/clojure.core/map/usagesthe function's profile showing its usages- etc.
- search and pagination
- a LOT more repos
Admittedly, much more polish is needed for both performance and UI improvements, but since it's already a useful resource and having it live will help me learn more about making better, I decided to go ahead with the release.
Coming Soon
You can expect many more features and improvements to land in the near future. I'll continue to refine the data pipeline and improve usability.
Since my post on Slack last week about relaunching, I addressed the few bugs that were reported in that thread:
- repo stargazer counts have been updated to be much more recent (not realtime)
- a small UI bug duplicating fn arities in the tooltip was fixed
- a bug in the DBT pipeline was fixed, adding approximately 400 repos that were previously missed
Please contact me on Slack @sheluchin if you have any feedback at all.
As for next, my top priorities are:
- stability, performance
- UI cleanup
- a REST API
At the moment, I'm not worried about the complete lack of mobile support, since I don't think this tool is very likely to be used on the go - you'll most likely be sitting at a desktop. I'm happy to re-prioritize this if I get feedback to the contrary.
I hope you find it useful. Go explore the ecosystem at seqfind.com and please let me know what you think!
Published: 2025-07-23
Tagged: clojure announcements projects seqfind
bb-fzf: A Babashka Tasks Picker
This post introduces a Babashka Tasks helper I put together make it easier to use bb tasks interactively. Here's the bb-fzf repo link.
The main things the helper adds are:
- the use of fzf for fuzzy task selection to help you type less
- the ability to invoke bb tasks from any sub-directory in your repo
- a bit of pretty-printing with the help of Bling
Babashka and fzf are two tools that are consistently part of my workflow, regardless of what I'm doing. I've briefly wrote about them in my previous post, PhuzQL: A GraphQL Fuzzy Finder, where I combined them together with Pathom to create a simple GraphQL explorer. In short, Babashka lets you write Clojure scripts with a fast startup time and fzf is an interactive picker with fuzzy text matching to save you some keystrokes.
Babashka includes a tasks feature that is somewhat like a Makefile replacement, allowing you to define named tasks in a bb.edn file and then execute them with bb <task name> [optional params]. bb-fzf just lets you pick from your list of tasks interactively - think of it as an ergonomic autocomplete.
A quick demo showing:
- simple task selection
- argument support
- output formatting (callouts, color, task selection, repo root)
Check out the README in the bb-fzf repo for more details on installation and usage. There's always room for improvement, but this is sufficient for my needs for now. In the future I might add a preview window and more robust argument handling with the help of babashka.cli.
Issues and PRs in the repo are welcome.
Published: 2025-04-03
PhuzQL: A Fuzzy GraphQL Explorer with Babashka, Pathom, and FZF (PoC)
I've recently been exploring new ways to make use of Pathom's indexes. The result is a very basic proof of concept implementation of an interactive GraphQL explorer. I'm going with the working title PhuzQL. This article explains the idea and implementation components.
You can find the code in my PhuzQL repo.
PhuzQL: A GraphQL Fuzzy Finder
First, a quick demo gif... 
- initially fzf opens at the root of the GraphQL index
- typing results in a fuzzy search of the available attributes
- arrow keys let you navigate the filtered list
- hovering over an item temporarily adds it to the query (like
totalCount) enterselects an item and updates the list with the newly reachable attributestaballows for multi-select, updating the query results in the preview window
Components
Pathom3
If you haven't heard of Pathom before, I covered a brief introduction in the previous post on Pathom3 Instrumentation. In short, Pathom is a Clojure library for navigating a graph of related attributes.
The point of leverage in this PoC is Pathom's index-io index, which tells us which attributes are directly reachable from the attributes you already have. In the demo above, we can only request specific attributes about all films once we've included the :swapi.FilmsConnection/films node in our query.
Further, the entire Pathom environment is created by consuming the SWAPI GraphQL index. This is done with pathom3-graphql which uses dynamic resolvers to translate the GraphQL index to a Pathom graph that can easily be queried using EQL.
See the docs on Pathom3 GraphQL Integration for more details.
Babashka & fzf
Babashka is a scripting environment for Clojure. It has a very fast startup time which is important here to make the interactive experience smoother. PhuzQL uses it to invoke fzf, the interactive fuzzy-finder used to filter and display query results. In the PoC implementation, I'm using the fzf.clj library which makes it easier to use fzf from Clojure. The preview window invokes an external Babashka script each time each time the attribute selection changes.
Potential Improvements
This project is very much in the experimental state. Some improvements that could be made:
- easier usage, user-configurable GraphQL API selection
- parameters
- multiple query branches
- query navigation
- preview window colors and metadata
- data visualizations
- copying results and queries
It has been fun piecing this together so far. I'm not entirely certain I'll be iterating on it more in the near future, but I'll take some hammock time to think about applications that could be interesting. In general, I think putting these components together shortens the feedback loop in working with GraphQL APIs. It can be used for API exploration, data analysis and IDE integration.
Published: 2025-02-21
Tagged: interactive clojure explorer graphql fzf proof-of-concept babashka api pathom