Pathom3 Instrumentation
In this article I will explain how to get performance insights into your Pathom3 resolvers by using Tufte. My aim is to show a very basic example of how it can be done, without doing a deep dive on any of the topics.
Pathom
If you are unfamiliar with Pathom, its docs define it as "a Clojure/script library to model attribute relationships". In essence, Pathom allows you to create graph of related keywords and query it using the EDN Query Language (EQL). It supports read and write operations using resolvers and mutations. The "magic" of it is that it produces an interface which abstracts away function calling by handling all the graph traversal internally when responding to EQL requests. What does that mean? A short example should suffice:
;; create a few resolvers to model related attributes
(pco/defresolver all-items
  "Takes no input and outputs `:all-items` with their `:id`."
  []
  {::pco/output [{:all-items [:id]}]}
  {:all-items
   [{:id 1}
    {:id 2}
    {:id 3}]})

(pco/defresolver fetch-v
  "Takes an `:id` and outputs its `:v`."
  [{:keys [id]}]
  (Thread/sleep 300)
  {:v (* 10 id)})

;; query the graph for some data
(p.eql/process
 (pci/register [all-items fetch-v])
 ;; ask for the `:v` attribute of `:all-items`
 [{:all-items [:v]}])
; => {:all-items [{:v 10} {:v 20} {:v 30}]}
Source: Pathom3 docs on Batch Resolvers.
As you can see, once the graph is established, you only need to tell Pathom what you want, not how to get it. As long as there is enough data to satisfy the input requirements of some initial resolver, its output can be used as input to whatever other resolver(s) need to be used in order to satisfy the entire request. Pathom will continue traversing the graph using whatever data it has at each point in order to get all the requested attributes. An elaborate chain of function calls is reduced to a single EQL expression.
While this does offer developers a great deal of power, one trade-off is that it becomes a little bit harder to understand exactly what your program is doing when you send your query to the Pathom parser. The above example creates a very simple graph without much mystery, but real applications often include a large number of resolvers, often with multiple paths for getting certain attributes.
Tufte
Tufte is useful for understanding what happens when you send a query to your Pathom parser. From the Tufte example in its repo's README, the basic usage is like this:
(tufte/profile ; Profile any `p` forms called during body execution
  {} ; Profiling options; we'll use the defaults for now
  (dotimes [_ 5]
    (tufte/p :get-x (get-x))
    (tufte/p :get-y (get-y))))
In plain English, we need to use p to wrap individual expressions and profile to wrap a set of p expressions to profile them together.
Profiling Pathom Queries
To put it together, we need to understand one last piece: Pathom Plugins. Plugins allow developers to extend Pathom's functionality by wrapping specific parts of its internal execution process with arbitrary extension code. The various places you can add wrapping are identified by keywords. In our case, we want to wrap individual resolver calls with p and the entire process (which may call many resolvers) with profile. The keywords for these extension points are:
::pcr/wrap-resolvefor individual resolvers::p.eql/wrap-process-astfor the entire process
With this knowledge, we can create some extension functions and register the plugin:
(defn tufte-resolver-wrapper
  "Wrap a Pathom3 resolver call in `tufte/p`."
  [resolver]
  (fn [env input]
    (let [resolver-name (-> (get-in env [::pcp/node ::pco/op-name])
                            (name)
                            (keyword))
          identifier (str "resolver: " resolver-name)]
      (tufte/p identifier (resolver env input)))))

(defn tufte-process-wrapper
  "Wrap a Pathom3 process in `tufte/profile`."
  [process-ast]
  (fn [env ast] (tufte/profile {} (process-ast env ast))))

(p.plugin/defplugin tufte-profile-plugin
  {::p.plugin/id `tufte-profile-plugin
   ::pcr/wrap-resolve tufte-resolver-wrapper
   ::p.eql/wrap-process-ast tufte-process-wrapper})
The last step is to include this plugin in Pathom's environment when processing a query:
;; Add handler to print results to *out*
(tufte/add-basic-println-handler! {})

(p.eql/process
;; Only the first form is new, everything else is as before.
 (-> (p.plugin/register tufte-profile-plugin)
     (pci/register [all-items fetch-v]))
 [{:all-items [:v]}])
 ; => {:all-items [{:v 10} {:v 20} {:v 30}]}
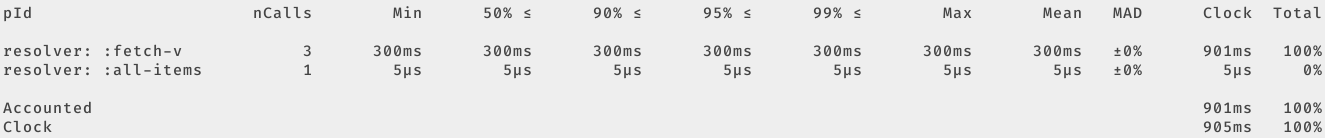
If you follow along with the Batch Resolvers docs linked above, you can see how to optimize such a situation to avoid the N+1 query and the extra 600ms of processing time it causes. Let's replace the fetch-v resolver with its batch version and profile it again:
(pco/defresolver batch-fetch-v
  "Takes a _batch_ of `:id`s and outputs their `:v`."
  [items]
  {::pco/input  [:id]
   ::pco/output [:v]
   ::pco/batch? true}
  (Thread/sleep 300)
  (mapv #(hash-map :v (* 10 (:id %))) items))

(p.eql/process
  (-> (p.plugin/register tufte-profile-plugin)
      (pci/register [all-items #_fetch-v batch-fetch-v]))
  [{:all-items [:v]}])
; => {:all-items [{:v 10} {:v 20} {:v 30}]}

Comparing results, we can see the processing time saved by the batch version, exactly how much time was spent in each resolver and which resolvers were called. Again, this is a very simplified example. In a real-world scenario your may end up calling a large number of resolvers to produce the result, so having Tufte's stats at hand can be very useful.
Pathom Viz
As a final note, I want to point out that Pathom has its own tool for gaining such insights. It's called Pathom Viz and provides an excellent visual interface that shows everything you get from the above and more. It's a great tool and I use it often. Using Tufte as I've outlined above is an alternative lightweight approach that I've found useful.
Wrapping Up
In this article I covered a basic introduction to Pathom, its extension points and how to integrate it with Tufte in order to get performance and execution insights. Nothing groundbreaking here, but I did a quick search and didn't find any similar content, so hopefully this helps someone in the future.
You can find the complete working example code in my fnguy-examples repo.
Published: 2025-02-14
Tagged: clojure instrumentation tufte monitoring pathom performance